Edmonton area profile
Jasper Place
Covers the historic Jasper Place area and the west-central river-valley (Crestwood, Laurier Heights).
Jasper Place groups 21 Edmonton neighbourhoods — about 17,432 homes, 80.3% houses and 19.7% condos. The typical (median) house is assessed around $397,000, 12% below the citywide median; condos around $121,500. Across its established houses, the median assessed value changed +24% from 2012 to 2025. 59% of homes are owner-occupied, the average household income is about $111,656. Area figures are averages and City assessed values — directional, not sale prices ("typical" means the median; averages are noted as such).
“Jasper Place” follows the City of Edmonton's official Jasper Place planning district — one of 15 the City uses to group its 300+ neighbourhoods. Figures roll up the City's 2025 assessed values and the 2021 federal census across the area's neighbourhoods. Where a median can't be combined across neighbourhoods (income, age, shelter), the page shows the average instead — so those read higher than the medians on the neighbourhood pages and aren't directly comparable.
Neighbourhoods
21
profiled in this area
Total homes
17,432
80.3% houses · 19.7% condos
Typical house
$397,000
12% below citywide
Typical condo
$121,500
35% below citywide
House $/sq ft
$346
14% above citywide
Condo $/sq ft
$138
27% below citywide
Typical lot
6,555 ft²
22% above citywide
Avg. household income
$111,656
2021 · average, not median
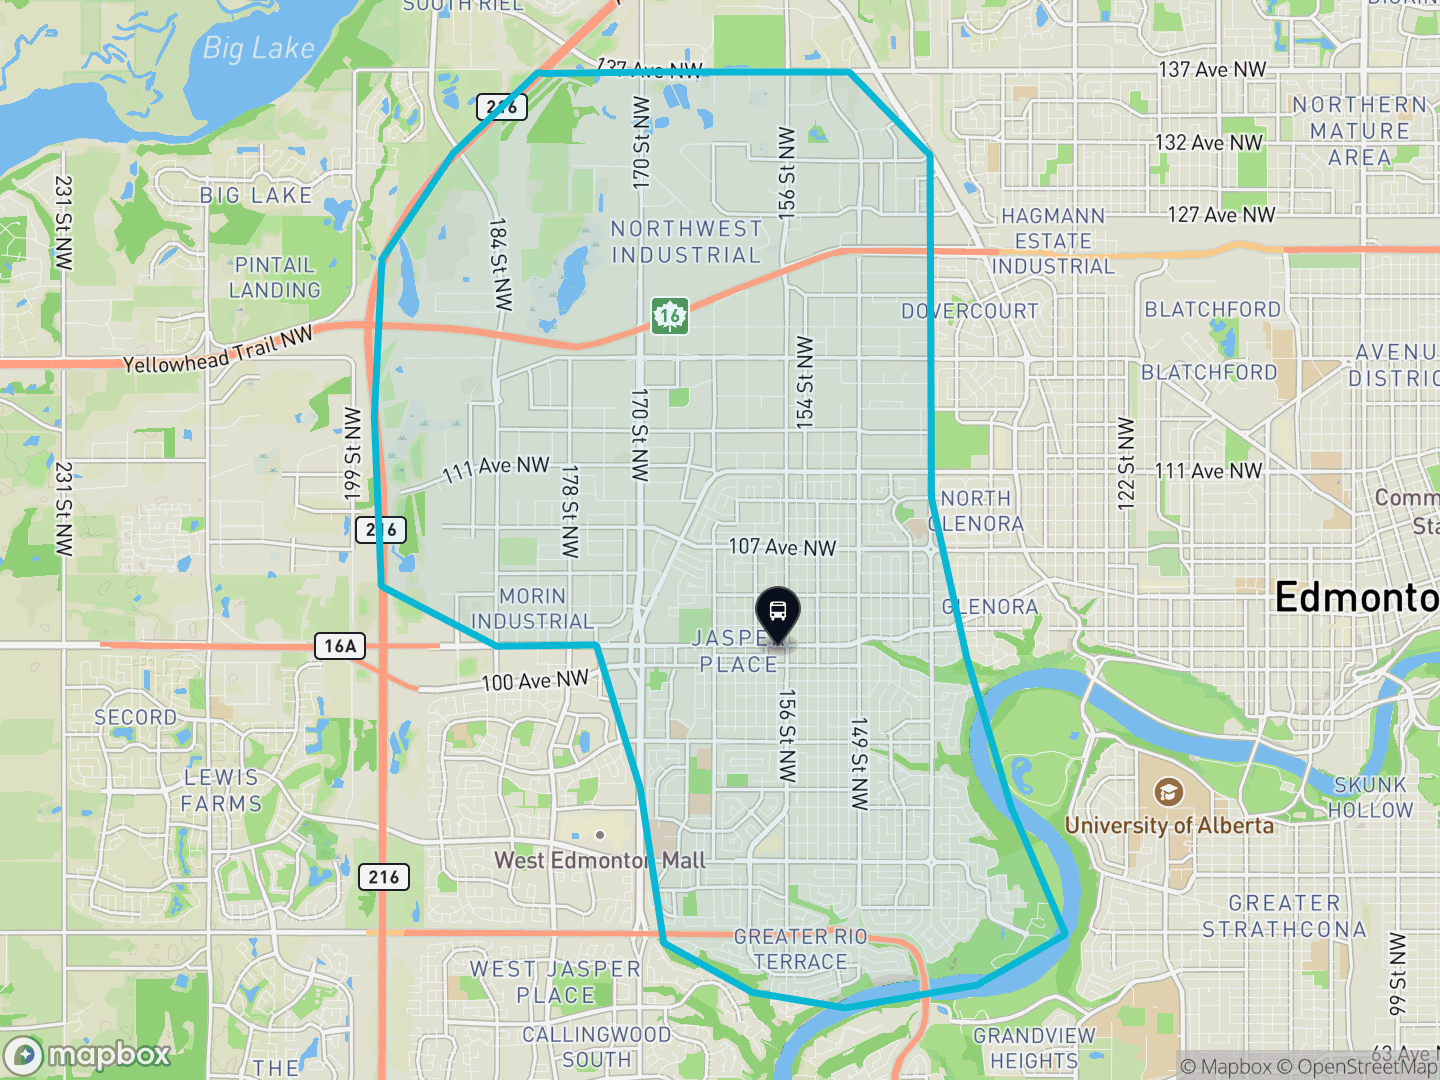
Where it is
At a glance. Jasper Place and its boundary, with LRT and transit centres marked — green areas are parks and open space.
Stay in the loop
Get the Edmonton market update
My monthly read — what's selling, where prices are headed, and what it means.
The homes
What's here, when it was built, and the condo & rental stock — rolled up across the area's neighbourhoods.
What's here
Mostly houses. 80.3% houses · 19.7% condos.
Built-form mix & bedrooms (2021 census · 123% coverage)
When it was built
Most homes here were built before 1960. The median build year is 1961.
Building age, by decade
Condos & multi-family
Condos are 19.7% of homes — most in Glenwood, Britannia Youngstown and West Meadowlark Park. Plus 327 purpose-built rental buildings.
How the condo & rental stock breaks down
Across roughly 223 condo developments, the largest about 430 units. Separately-titled parking and storage aren't counted as homes.
327 rental / multi-family buildings, typically built around 1978 — 117 small (under $1M), 194 mid ($1–10M), 16 large (over $10M). Purpose-built rentals (assessed as single parcels), separate from the owned homes; unit counts aren't in the open data.
Living here
Who lives in the area, what housing costs, and the schools, shopping, transit and parks across the district.
Who lives here
An even owner / renter mix. Average household income $111,656, average age 41.4.
Income, age and household size are averages (these combine exactly across neighbourhoods, where a median can't) — so they read higher than the medians shown on the neighbourhood pages. The distribution shares below are exact counts.
Income, households, ages, work & mobility
Household income (40% earn $100k+)
Households (average 2.3 people)
Ages (average 41.4)
Work — occupations
Work — industries
43% of residents moved here within the last 5 years (14% within the last year).
Origins, immigration & religion
74% born in Canada · 25% immigrants · 2% non-permanent residents.
Most commonly reported origins (multiple responses allowed — shares overlap)
Population groups
27% of residents identified as a visible minority; 73% did not. Separately, 9% identify as Indigenous.
StatCan defines a "visible minority" as "persons, other than Aboriginal peoples, who are non-Caucasian in race or non-white in colour" (Employment Equity Act) — so Indigenous residents are counted separately, and the "not a visible minority" share is predominantly residents who identify as white.
Religion
Immigration, ethnocultural origin, population group and religion from the 2021 federal census, summed across the district's neighbourhoods. Neutral Statistics Canada classifications, shown identically for every area.
Housing costs
Owners pay about $1,567/month; renters about $1,261/month. Average monthly shelter cost, 2021.
Schools
34 schools across Jasper Place — 24 public · 10 Catholic. Senior highs: Archbishop MacDonald, Edm Christian High, Jasper Place, St. Francis Xavier.
Schools by level & senior highs
Counts schools located in the district (a school offering several levels is counted in each). Public = Edmonton Public, Catholic = Edmonton Catholic. Fraser Institute rankings → · private/independent schools aren't in the City's open data.
Shopping
Major shopping centres here: Meadowlark Health & Shopping Centre.
Edmonton's major malls and power centres located in this district. Everyday retail (groceries, pharmacies, services) is spread across the neighbourhoods.
Transit
1 transit centre serve the area; no LRT here yet.
LRT stations & transit centres
Transit centres: Jasper Place Transit Centre.
Parks & green space
85 parks covering about 371 hectares, including 8 natural areas and river-valley / ravine greenway.
The largest parks
- Valley Zoo53 ha
- Bill Hunter Arena20 ha
- River Valley Capitol Hill Park 217 ha
The market
How assessed values have moved, and how much has been built.
Assessed value over time
The median assessed house value changed +24% from 2012 to 2025.
Established houses — largely the same properties over time, so this mostly reflects real value change.
Building activity
Since 2015: 7,834 building permits and 3,624 net new units, plus 783 secondary suites.
Permits, units & suites year by year
Permits count every new home — including purpose-built rental and mixed-use buildings — so the yearly units can run above the owned house/condo count above. “Units” are net of demolitions, so a redeveloping year can read negative; “suites” are secondary-suite permits (basement / garden / garage suites).
The neighbourhoods
Every neighbourhood in Jasper Place, sorted by number of homes — each links to its full data-driven profile.
- Glenwood 1,706 homes · typical house $350,000
- Britannia Youngstown 1,481 homes · typical house $335,500
- Parkview 1,406 homes · typical house $625,500
- Meadowlark Park 1,198 homes · typical house $379,500
- Canora 1,100 homes · typical house $309,500
- West Meadowlark Park 1,066 homes · typical house $367,000
- Grovenor 1,056 homes · typical house $424,000
- Laurier Heights 994 homes · typical house $705,000
- Crestwood 903 homes · typical house $736,750
- Mayfield 877 homes · typical house $322,500
- Elmwood 780 homes · typical house $361,000
- Lynnwood 779 homes · typical house $403,000
- West Jasper Place 747 homes · typical house $406,500
- High Park 640 homes · typical house $335,000
- Jasper Park 634 homes · typical house $365,500
- Rio Terrace 516 homes · typical house $524,500
- Sherwood 462 homes · typical house $337,500
- McQueen 461 homes · typical house $390,500
- Patricia Heights 443 homes · typical house $556,500
- Quesnell Heights 125 homes · typical house $867,500
- Kinokamau Plains Area 58 homes · typical house $659,750
Source
City of Edmonton Open Data — property assessment & property information, building permits (2025); Statistics Canada 2021 Census of Population (City of Edmonton neighbourhood tabulation); area boundaries from City Plan Districts. Contains information licensed under the Open Government Licence – City of Edmonton. Demographics: Statistics Canada 2021 Census of Population (City of Edmonton neighbourhood tabulation). Area boundaries: City Plan Districts.
About these figures. Area figures roll up the City's mass-appraisal assessed values and the 2021 federal census across this district's neighbourhoods — a directional, comparative signal, not the price a specific home would sell for. Income, age and shelter figures are averages (labelled), which read higher than medians and aren't directly comparable to the neighbourhood pages. Trevor Tardif is a licensed REALTOR® with REAL Broker AB Ltd, Edmonton, Alberta. Content on this site does not constitute financial or investment advice.
Zooming out: see the Edmonton economy — jobs, rents, vacancy and interest rates for the whole region.
Stay in the loop
Following Jasper Place? Get the bigger picture.
Jasper Place is one part of the city — but the forces that move its prices play out region-wide. That's what my market read tracks.
Weighing Jasper Place against another part of the city?
The profiles are the starting point. I'll run the comparison for your shortlist — what each area actually trades at, and which neighbourhoods fit what you're after — and walk you through it.