Edmonton area profile
Mill Woods and Meadows
Covers Mill Woods and The Meadows.
Mill Woods and Meadows groups 31 Edmonton neighbourhoods — about 40,136 homes, 75.7% houses and 24.3% condos. The typical (median) house is assessed around $423,500, 6% below the citywide median; condos around $189,500. Across its established houses, the median assessed value changed +28% from 2012 to 2025. 72% of homes are owner-occupied, the average household income is about $107,472. Area figures are averages and City assessed values — directional, not sale prices ("typical" means the median; averages are noted as such).
“Mill Woods and Meadows” follows the City of Edmonton's official Mill Woods and Meadows planning district — one of 15 the City uses to group its 300+ neighbourhoods. Figures roll up the City's 2025 assessed values and the 2021 federal census across the area's neighbourhoods. Where a median can't be combined across neighbourhoods (income, age, shelter), the page shows the average instead — so those read higher than the medians on the neighbourhood pages and aren't directly comparable.
Neighbourhoods
31
profiled in this area
Total homes
40,136
75.7% houses · 24.3% condos
Typical house
$423,500
6% below citywide
Typical condo
$189,500
1% above citywide
House $/sq ft
$313
3% above citywide
Condo $/sq ft
$179
6% below citywide
Typical lot
5,307 ft²
1% below citywide
Avg. household income
$107,472
2021 · average, not median
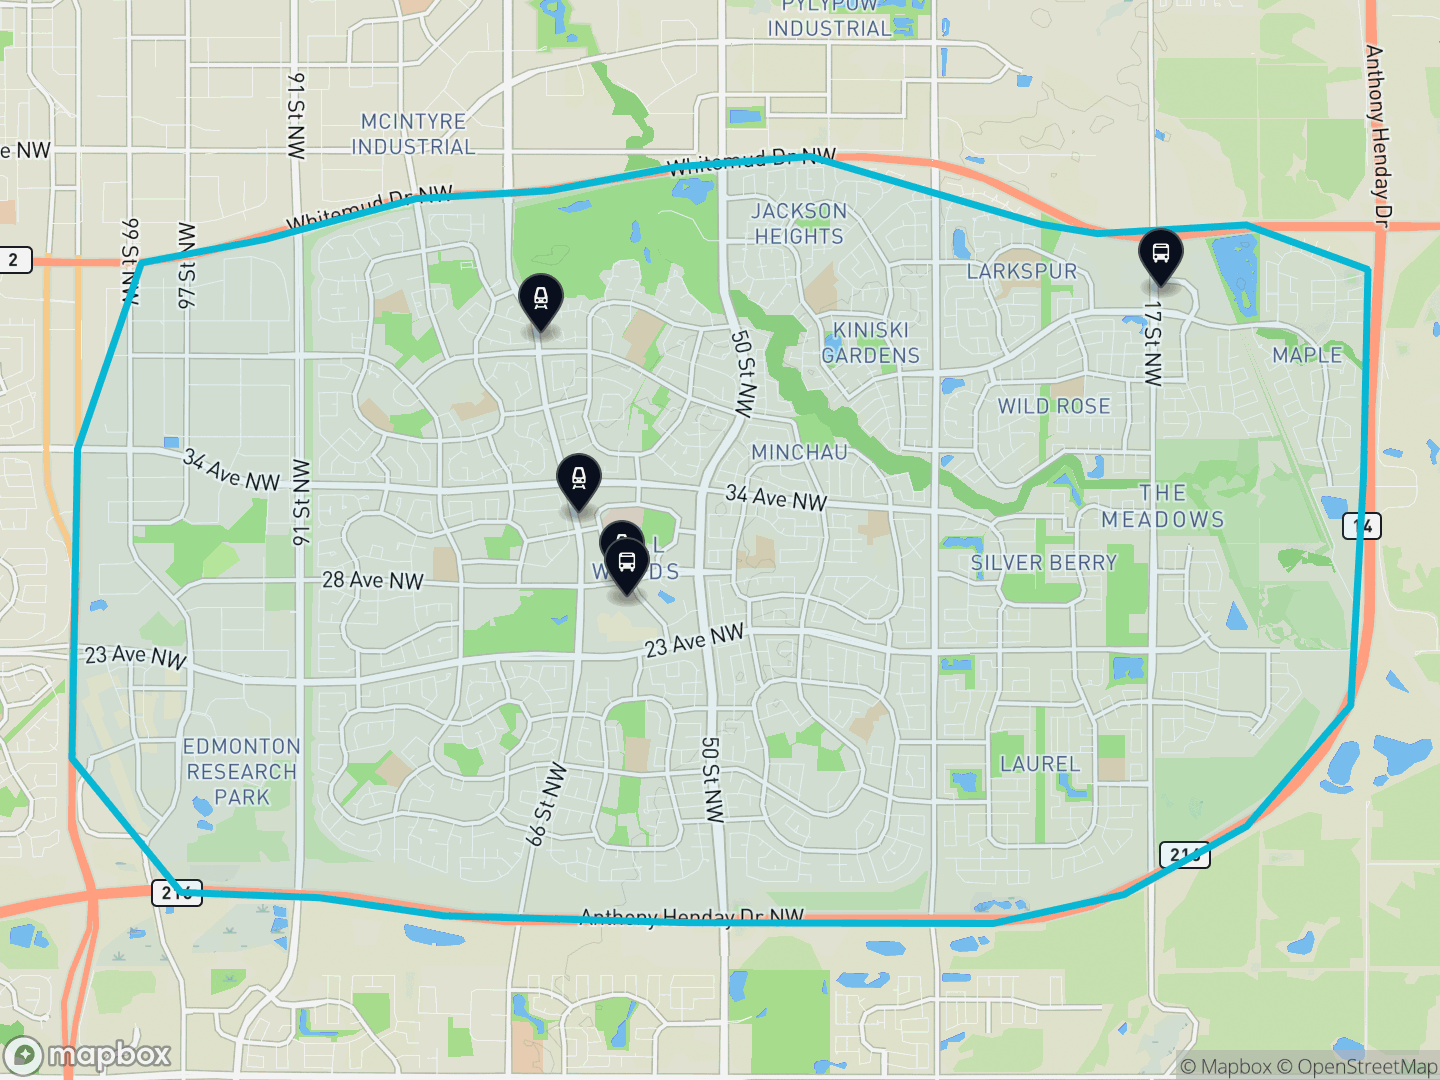
Where it is
At a glance. Mill Woods and Meadows and its boundary, with LRT and transit centres marked — green areas are parks and open space.
Stay in the loop
Get the Edmonton market update
My monthly read — what's selling, where prices are headed, and what it means.
The homes
What's here, when it was built, and the condo & rental stock — rolled up across the area's neighbourhoods.
What's here
Mostly houses. 75.7% houses · 24.3% condos.
Built-form mix & bedrooms (2021 census · 105% coverage)
When it was built
Most homes here were built in the 1970s. The median build year is 1990.
Building age, by decade
Condos & multi-family
Condos are 24.3% of homes — most in Tawa, Larkspur and Silver Berry. Plus 125 purpose-built rental buildings.
How the condo & rental stock breaks down
Across roughly 206 condo developments, the largest about 243 units. Separately-titled parking and storage aren't counted as homes.
125 rental / multi-family buildings, typically built around 1988 — 19 small (under $1M), 54 mid ($1–10M), 52 large (over $10M). Purpose-built rentals (assessed as single parcels), separate from the owned homes; unit counts aren't in the open data.
Living here
Who lives in the area, what housing costs, and the schools, shopping, transit and parks across the district.
Who lives here
Mostly homeowners. Average household income $107,472, average age 37.1.
Income, age and household size are averages (these combine exactly across neighbourhoods, where a median can't) — so they read higher than the medians shown on the neighbourhood pages. The distribution shares below are exact counts.
Income, households, ages, work & mobility
Household income (48% earn $100k+)
Households (average 3 people)
Ages (average 37.1)
Work — occupations
Work — industries
40% of residents moved here within the last 5 years (13% within the last year).
Origins, immigration & religion
56% born in Canada · 40% immigrants · 4% non-permanent residents.
Most commonly reported origins (multiple responses allowed — shares overlap)
Population groups
55% of residents identified as a visible minority; 44% did not. Separately, 5% identify as Indigenous.
StatCan defines a "visible minority" as "persons, other than Aboriginal peoples, who are non-Caucasian in race or non-white in colour" (Employment Equity Act) — so Indigenous residents are counted separately, and the "not a visible minority" share is predominantly residents who identify as white.
Religion
Immigration, ethnocultural origin, population group and religion from the 2021 federal census, summed across the district's neighbourhoods. Neutral Statistics Canada classifications, shown identically for every area.
Housing costs
Owners pay about $1,675/month; renters about $1,381/month. Average monthly shelter cost, 2021.
Schools
44 schools across Mill Woods and Meadows — 32 public · 12 Catholic. Senior highs: Elder Dr. Francis Whiskeyjack, Holy Trinity, J. Percy Page, Millwoods Christian.
Schools by level & senior highs
Counts schools located in the district (a school offering several levels is counted in each). Public = Edmonton Public, Catholic = Edmonton Catholic. Fraser Institute rankings → · private/independent schools aren't in the City's open data.
Shopping
Major shopping centres here: Mill Woods Town Centre, The Meadows Shopping Centre.
Edmonton's major malls and power centres located in this district. Everyday retail (groceries, pharmacies, services) is spread across the neighbourhoods.
Transit
Served by the Valley Line, with 3 LRT stations in the area and 2 transit centres.
LRT stations & transit centres
LRT: Grey Nuns (Valley Line Southeast), Mill Woods (Valley Line Southeast), Millbourne Woodvale (Valley Line Southeast).
Transit centres: Meadows Transit Centre, Mill Woods Transit Centre.
Parks & green space
77 parks covering about 591 hectares, including 7 natural areas and river-valley / ravine greenway.
The largest parks
- Mill Woods Golf124 ha
- Upper Mill Creek Ravine61 ha
- Bob White Field27 ha
The market
How assessed values have moved, and how much has been built.
Assessed value over time
The median assessed house value changed +28% from 2012 to 2025.
Established houses — largely the same properties over time, so this mostly reflects real value change.
Building activity
Since 2015: 12,344 building permits and 9,658 net new units, plus 1,407 secondary suites.
Permits, units & suites year by year
Permits count every new home — including purpose-built rental and mixed-use buildings — so the yearly units can run above the owned house/condo count above. “Units” are net of demolitions, so a redeveloping year can read negative; “suites” are secondary-suite permits (basement / garden / garage suites).
The neighbourhoods
Every neighbourhood in Mill Woods and Meadows, sorted by number of homes — each links to its full data-driven profile.
- Laurel 4,275 homes · typical house $520,000
- Silver Berry 2,555 homes · typical house $446,000
- Wild Rose 2,476 homes · typical house $478,250
- Kiniski Gardens 2,212 homes · typical house $376,500
- Larkspur 1,932 homes · typical house $468,000
- Tamarack 1,860 homes · typical house $471,500
- Maple 1,655 homes · typical house $469,500
- Crawford Plains 1,389 homes · typical house $384,500
- Pollard Meadows 1,355 homes · typical house $389,500
- Jackson Heights 1,269 homes · typical house $459,500
- Sakaw 1,213 homes · typical house $374,250
- Satoo 1,202 homes · typical house $381,500
- Meyonohk 1,105 homes · typical house $377,000
- Weinlos 1,092 homes · typical house $362,750
- Daly Grove 1,084 homes · typical house $382,250
- Hillview 1,084 homes · typical house $394,500
- Minchau 998 homes · typical house $380,750
- Greenview 996 homes · typical house $440,000
- Bisset 984 homes · typical house $393,000
- Meyokumin 941 homes · typical house $385,500
- Aster 895 homes · typical house $537,500
- Menisa 870 homes · typical house $393,500
- Tawa 864 homes · typical house $10,655,000
- Michaels Park 857 homes · typical house $394,750
- Tipaskan 820 homes · typical house $384,500
- Lee Ridge 797 homes · typical house $392,000
- Kameyosek 754 homes · typical house $365,250
- Tweddle Place 747 homes · typical house $396,000
- Ekota 694 homes · typical house $404,000
- Richfield 686 homes · typical house $371,000
- Mill Woods Town Centre 475 homes
Source
City of Edmonton Open Data — property assessment & property information, building permits (2025); Statistics Canada 2021 Census of Population (City of Edmonton neighbourhood tabulation); area boundaries from City Plan Districts. Contains information licensed under the Open Government Licence – City of Edmonton. Demographics: Statistics Canada 2021 Census of Population (City of Edmonton neighbourhood tabulation). Area boundaries: City Plan Districts.
About these figures. Area figures roll up the City's mass-appraisal assessed values and the 2021 federal census across this district's neighbourhoods — a directional, comparative signal, not the price a specific home would sell for. Income, age and shelter figures are averages (labelled), which read higher than medians and aren't directly comparable to the neighbourhood pages. Trevor Tardif is a licensed REALTOR® with REAL Broker AB Ltd, Edmonton, Alberta. Content on this site does not constitute financial or investment advice.
Zooming out: see the Edmonton economy — jobs, rents, vacancy and interest rates for the whole region.
Stay in the loop
Following Mill Woods and Meadows? Get the bigger picture.
Mill Woods and Meadows is one part of the city — but the forces that move its prices play out region-wide. That's what my market read tracks.
Weighing Mill Woods and Meadows against another part of the city?
The profiles are the starting point. I'll run the comparison for your shortlist — what each area actually trades at, and which neighbourhoods fit what you're after — and walk you through it.