Edmonton area profile
Rabbit Hill
Covers an emerging far-southwest growth district (one neighbourhood so far).
Rabbit Hill groups 1 Edmonton neighbourhoods — about 72 homes, 100% houses and 0% condos. The typical (median) house is assessed around $929,750, 107% above the citywide median. Across its established houses, the median assessed value changed +35% from 2019 to 2025. Area figures are averages and City assessed values — directional, not sale prices ("typical" means the median; averages are noted as such).
“Rabbit Hill” follows the City of Edmonton's official Rabbit Hill planning district — one of 15 the City uses to group its 300+ neighbourhoods. Figures roll up the City's 2025 assessed values and the 2021 federal census across the area's neighbourhoods. Where a median can't be combined across neighbourhoods (income, age, shelter), the page shows the average instead — so those read higher than the medians on the neighbourhood pages and aren't directly comparable.
Neighbourhoods
1
profiled in this area
Total homes
72
100% houses · 0% condos
Typical house
$929,750
107% above citywide
House $/sq ft
$413
36% above citywide
Typical lot
437,542 ft²
8066% above citywide
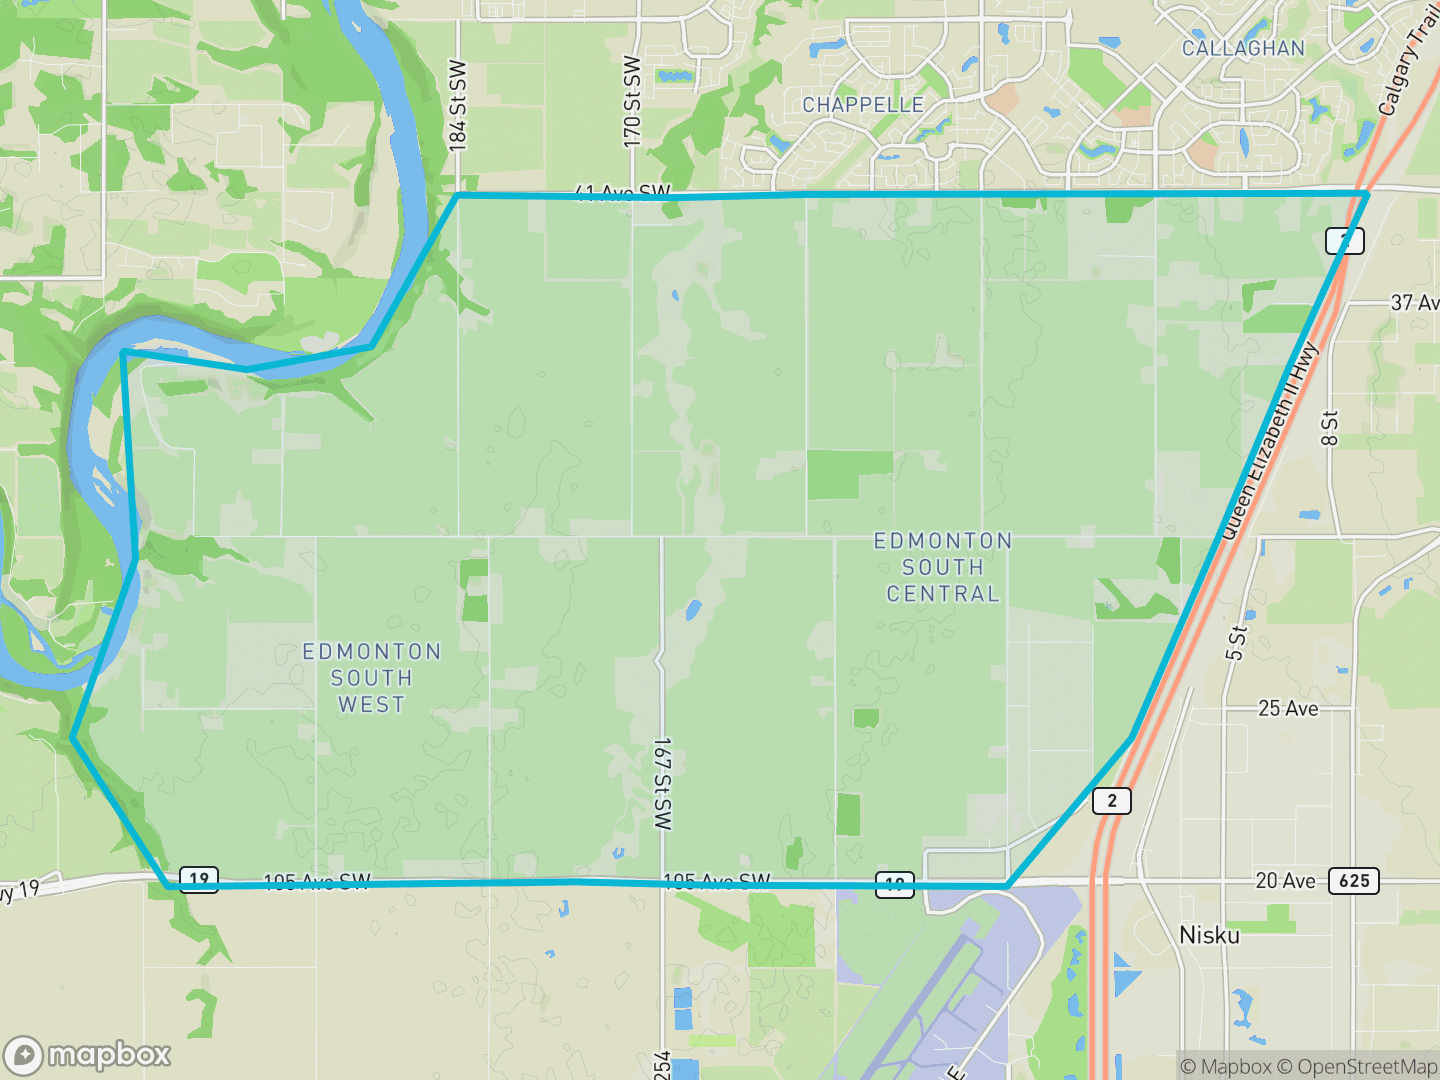
Where it is
At a glance. Rabbit Hill and its boundary — green areas are parks and open space.
Stay in the loop
Get the Edmonton market update
My monthly read — what's selling, where prices are headed, and what it means.
The homes
What's here, when it was built, and the condo & rental stock — rolled up across the area's neighbourhoods.
What's here
Mostly houses. 100% houses · 0% condos.
When it was built
Most homes here were built in the 1970s. The median build year is 1982.
Building age, by decade
The market
How assessed values have moved, and how much has been built.
Assessed value over time
The median assessed house value changed +35% from 2019 to 2025.
Established houses — largely the same properties over time, so this mostly reflects real value change.
Building activity
Since 2019: 8 building permits and 2 net new units.
Permits, units & suites year by year
Permits count every new home — including purpose-built rental and mixed-use buildings — so the yearly units can run above the owned house/condo count above. “Units” are net of demolitions, so a redeveloping year can read negative; “suites” are secondary-suite permits (basement / garden / garage suites).
The neighbourhoods
Every neighbourhood in Rabbit Hill, sorted by number of homes — each links to its full data-driven profile.
Source
City of Edmonton Open Data — property assessment & property information, building permits (2025); Statistics Canada 2021 Census of Population (City of Edmonton neighbourhood tabulation); area boundaries from City Plan Districts. Contains information licensed under the Open Government Licence – City of Edmonton. Demographics: Statistics Canada 2021 Census of Population (City of Edmonton neighbourhood tabulation). Area boundaries: City Plan Districts.
About these figures. Area figures roll up the City's mass-appraisal assessed values and the 2021 federal census across this district's neighbourhoods — a directional, comparative signal, not the price a specific home would sell for. Income, age and shelter figures are averages (labelled), which read higher than medians and aren't directly comparable to the neighbourhood pages. Trevor Tardif is a licensed REALTOR® with REAL Broker AB Ltd, Edmonton, Alberta. Content on this site does not constitute financial or investment advice.
Zooming out: see the Edmonton economy — jobs, rents, vacancy and interest rates for the whole region.
Stay in the loop
Following Rabbit Hill? Get the bigger picture.
Rabbit Hill is one part of the city — but the forces that move its prices play out region-wide. That's what my market read tracks.
Weighing Rabbit Hill against another part of the city?
The profiles are the starting point. I'll run the comparison for your shortlist — what each area actually trades at, and which neighbourhoods fit what you're after — and walk you through it.